Brief
A public 8,000-customer campaign dataset — spend, click-through rate, a conversion-rate field, and a converted/didn't-convert outcome, split across five channels (PPC, SEO, Social Media, Email, Referral) and four campaign types. It's a practice dataset rather than a live ad account export, so this reads as a directional exercise in the same questions a real account review asks: does channel or campaign type actually move conversion, and if not those, what does?
Cleaning
QA pass across all 20 columns: df.isna().sum() returned zero missing values,
and zero duplicate CustomerID rows. Two columns —
AdvertisingPlatform and AdvertisingTool — turned out to hold a
single placeholder value across every one of the 8,000 rows ("IsConfid" and
"ToolConfid" respectively — redacted rather than genuinely captured), so they
were dropped before analysis rather than treated as real signal. The categorical fields
checked out cleanly: Gender splits 4,839 Female / 3,161 Male, the five
CampaignChannel values and four CampaignType values are
each represented in the low-to-mid thousands with no rare or malformed categories, and every
numeric field's observed range matched what you'd expect (age 18–69, income
$20,014–$149,986) with no negative values or impossible outliers.
Data profile
Descriptive statistics for the demographic, spend and engagement fields used below.
| Field | Min | Mean | Median | Max | Std dev |
|---|---|---|---|---|---|
| Age | 18 | 43.6 | 43 | 69 | 14.9 |
| Income ($) | 20,014 | 84,664 | 84,927 | 149,986 | 37,580 |
| AdSpend ($) | 100 | 5,001 | 5,013 | 9,998 | 2,838 |
| ClickThroughRate | 0.01 | 0.155 | 0.155 | 0.30 | 0.084 |
| ConversionRate | 0.01 | 0.104 | 0.104 | 0.20 | 0.055 |
| WebsiteVisits | 0 | 24.8 | 25 | 49 | 14.3 |
| PagesPerVisit | 1.0 | 5.5 | 5.5 | 10.0 | 2.6 |
| TimeOnSite (min) | 0.5 | 7.7 | 7.7 | 15.0 | 4.2 |
| SocialShares | 0 | 49.8 | 50 | 99 | 28.9 |
| EmailOpens | 0 | 9.5 | 9 | 19 | 5.7 |
| EmailClicks | 0 | 4.5 | 4 | 9 | 2.9 |
| PreviousPurchases | 0 | 4.5 | 4 | 9 | 2.9 |
| LoyaltyPoints | 0 | 2,490 | 2,497 | 4,999 | 1,430 |
Channel performance
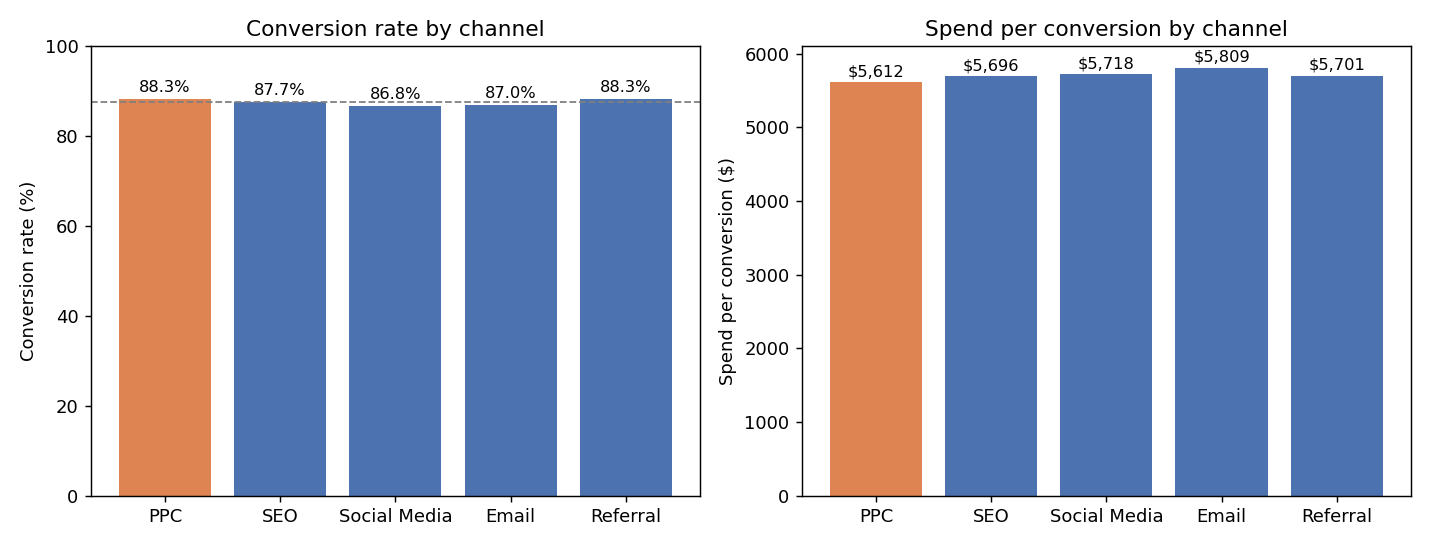
Across the five channels, conversion rate barely moves — everything sits between 86.8% and 88.3%, and spend-per-conversion is just as tight, between $5,612 and $5,809. PPC — the closest analog here to Google-Ads-style paid search — lands right in the middle of the pack on both measures, not a standout in either direction.
Campaign type is where the real gap is
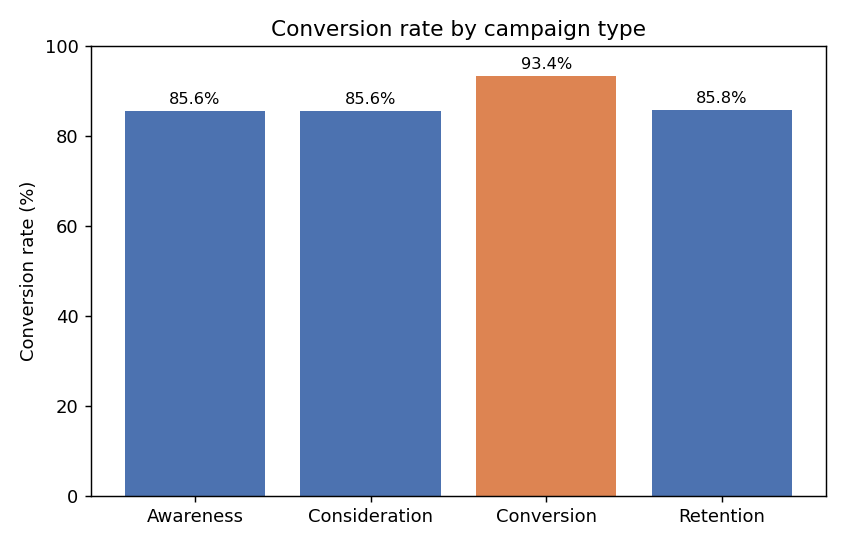
Campaign type tells a clearer story than channel does. Bottom-of-funnel "Conversion"-type campaigns convert at 93.4%, well above Awareness, Consideration and Retention campaigns, which all sit around 85.6–85.8%. That's the one genuinely sizeable gap anywhere in this dataset.
What actually correlates with conversion?
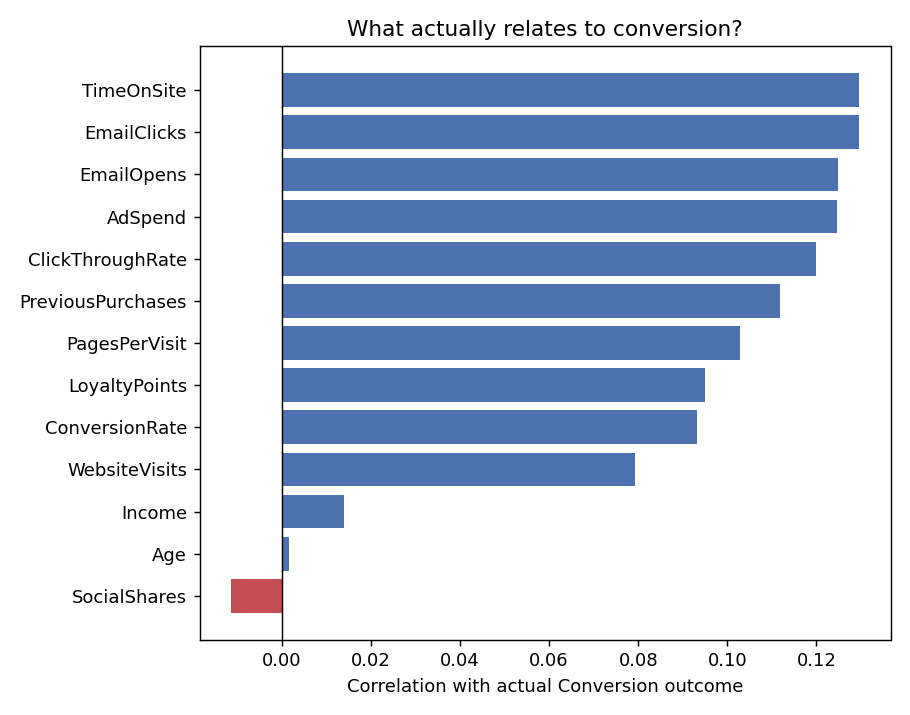
Running every numeric field against the actual conversion outcome, nothing comes close to a strong relationship — the top correlation is only 0.13. Age, income and social shares are essentially unrelated to conversion (all under 0.02, one slightly negative). What little signal exists sits with on-site and email engagement, spend, and click-through rate — all real but modest.
Engagement, not demographics
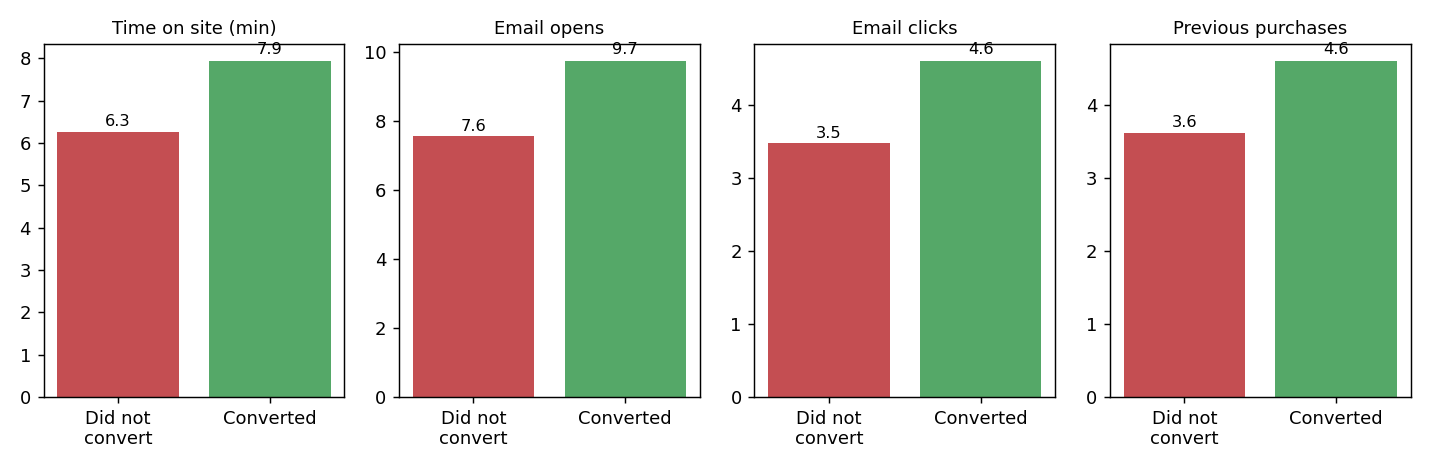
Converted customers consistently show more engagement than those who didn't convert — more time on site, more email opens and clicks, more prior purchases — even though none of those gaps are dramatic on their own.
A data-quality note
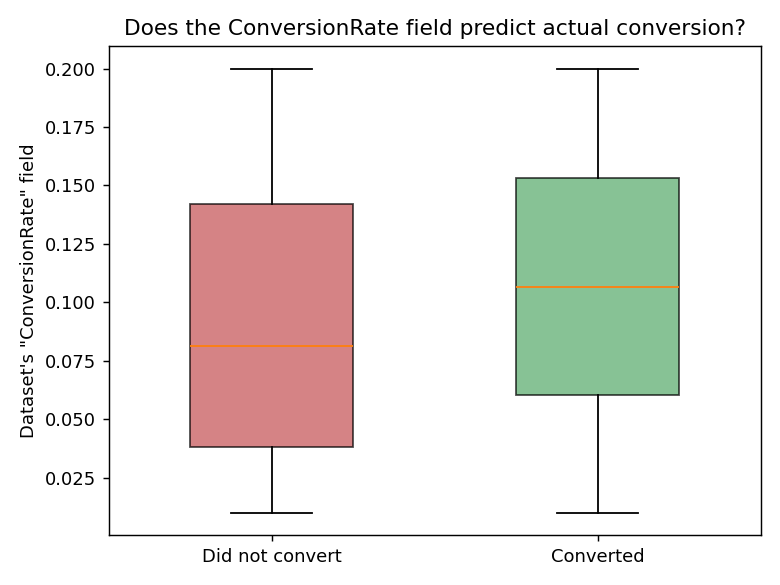
The dataset ships its own ConversionRate field (0–0.2, one per customer) as well
as the actual converted/didn't-convert outcome — worth checking whether the two agree. They
point the same direction (converted customers score higher: median 0.107 vs. 0.081) but
overlap heavily, matching the same 0.09 correlation seen above. Combined with every numeric
field in this dataset being close to uniformly distributed, that's consistent with this being
a synthetically generated practice dataset rather than a real captured ad log — a reason to
read the findings here as directional, not as a stand-in for a live account.
What this means
- 01Channel choice alone isn't doing much work here — with all five channels landing within about a point and a half of each other, reallocating budget between channels on this data wouldn't be expected to move conversion.
- 02Campaign type is the one lever that matters: weighting spend toward bottom-of-funnel, conversion-stage campaigns tracks with a real (~8pt) lift over awareness or retention framing.
- 03Engagement signals — time on site, email opens and clicks, repeat purchase history — are the closest thing to a leading indicator in this data, well ahead of demographic targeting by age or income.
- 04Given the uniform spread across every feature, this is best read as a directional exercise in the right questions to ask of a live account, not as a finding to act on directly.