Brief
A 142-row HR dataset — demographics, tenure, income, a 0–100 satisfaction score, and an open-ended text review per employee. Three angles on the same question — what's actually driving satisfaction: unsupervised clustering to find natural employee segments, a decision tree to rank which features predict dissatisfaction, and sentiment analysis on the free-text reviews themselves.
Cleaning
Two missing values in the free-text review column were filled with
"No feedback provided" rather than dropped, to keep every row for the numeric
analysis. No duplicate rows. Columns were renamed to consistent snake_case, and the
row_id identifier was dropped before modelling since it carries no signal.
Exploring the data
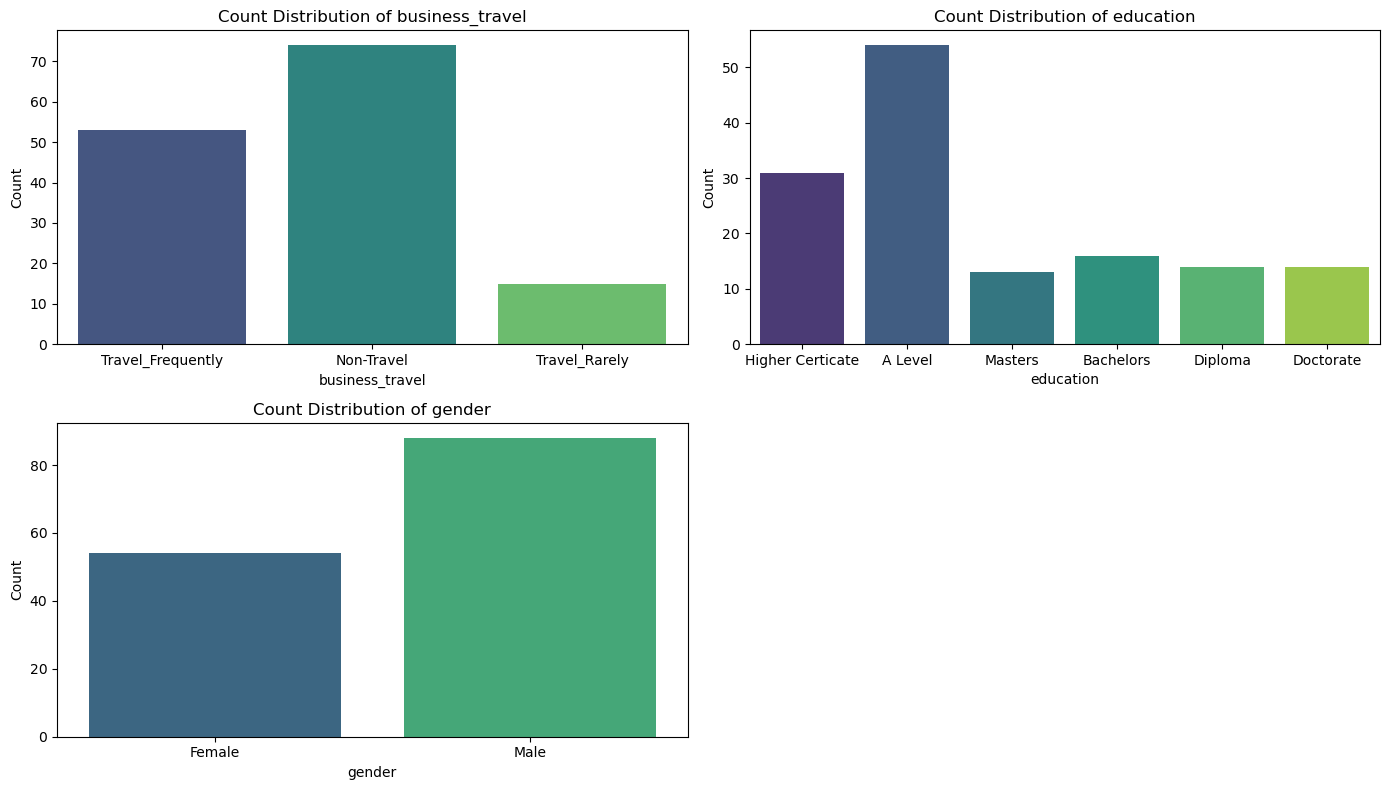
Business travel splits roughly 52% non-travel, 37% frequent travellers, and the rest rarely-travel. Education skews toward A-Level and Higher Certificate holders, with Bachelors, Diploma, Masters and Doctorate each in the minority. The workforce is 62% male, 38% female.
What correlates with satisfaction
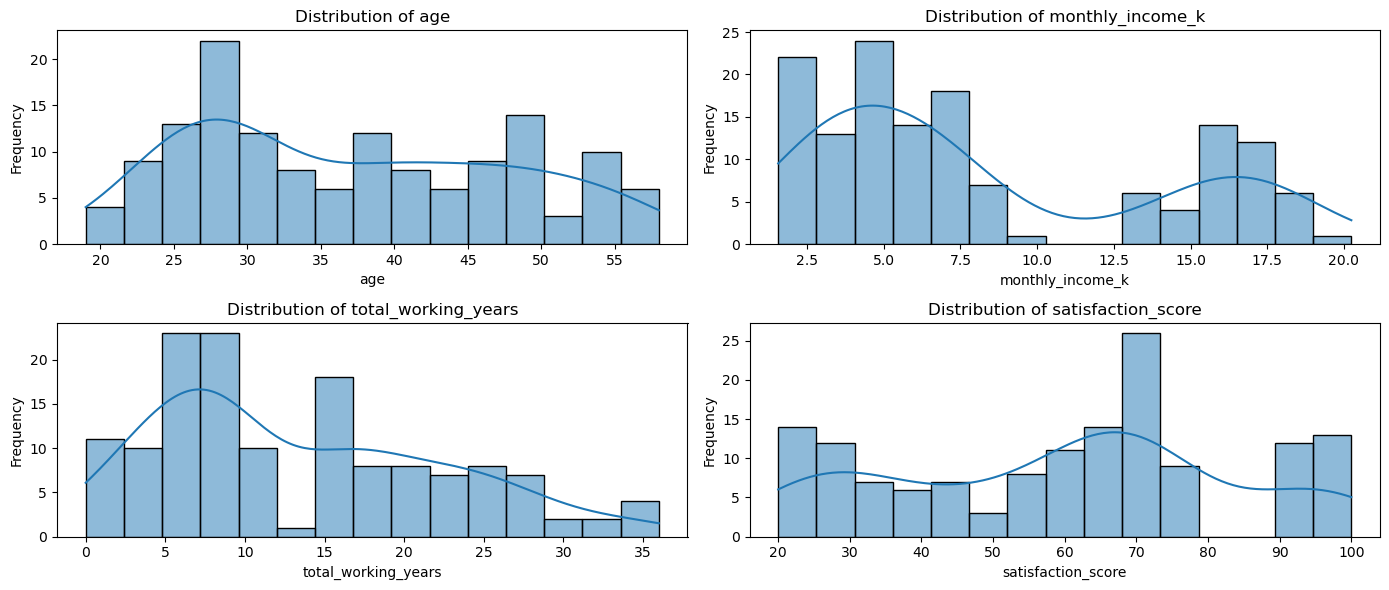
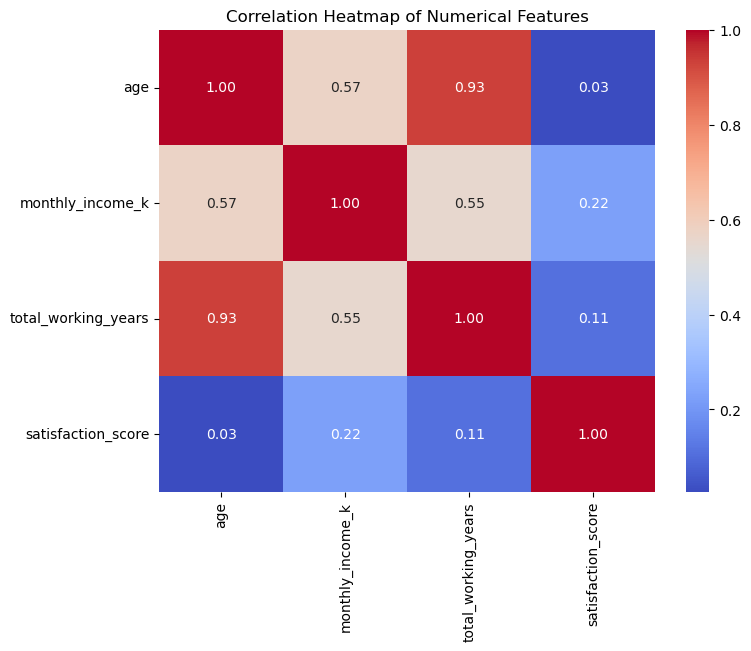
The standout relationship in the data isn't with satisfaction at all: age and total working years are strongly correlated (0.93) — unsurprising, since tenure accumulates with age. Income correlates moderately with both age (0.57) and tenure (0.55). Satisfaction score, though, barely moves with any of them — age (0.03), tenure (0.11), income (0.22) — which suggests seniority and pay aren't what's driving how satisfied people say they are.
Preparing for clustering
Numeric features (age, income, tenure, satisfaction) were Min-Max scaled to a 0–1 range, and the three categorical fields (business travel, education, gender) were label-encoded, since K-Means needs purely numeric input.
K-Means: how many segments?
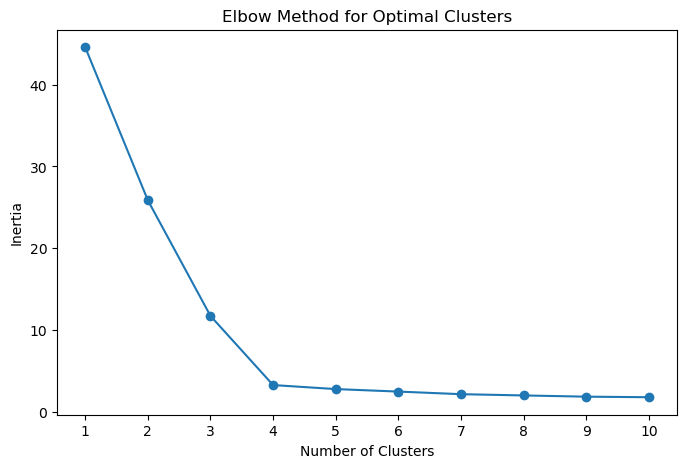
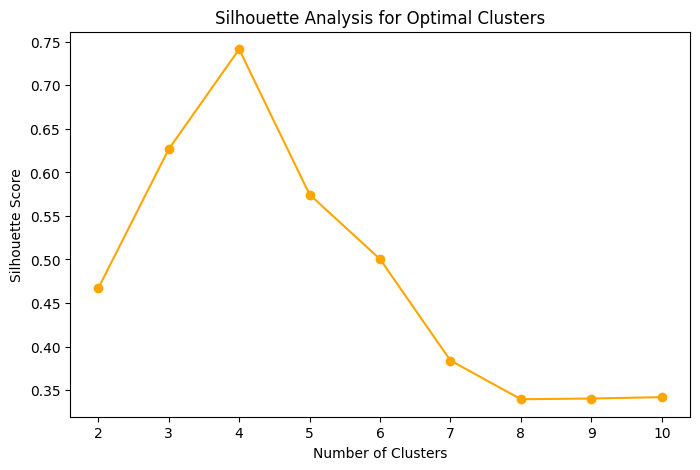
Running the elbow method across k = 1 to 10, inertia drops sharply through k = 4 and flattens out after that. A silhouette analysis over the same range agrees — k = 4 scores highest at 0.74, well clear of every other option — so both methods point to the same number of segments.
Four employee segments
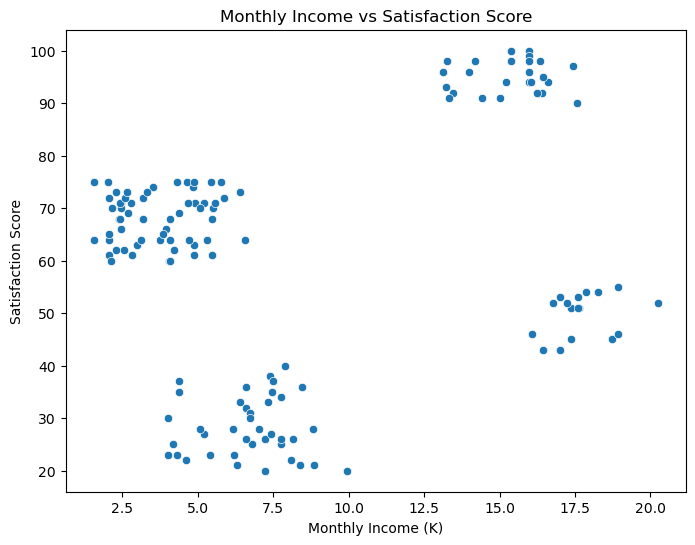
Fitting K-Means with k = 4 on scaled age, income, tenure and satisfaction splits the workforce into four fairly distinct groups when plotted on income against satisfaction — and the chart makes one thing obvious straight away: income alone doesn't predict satisfaction.
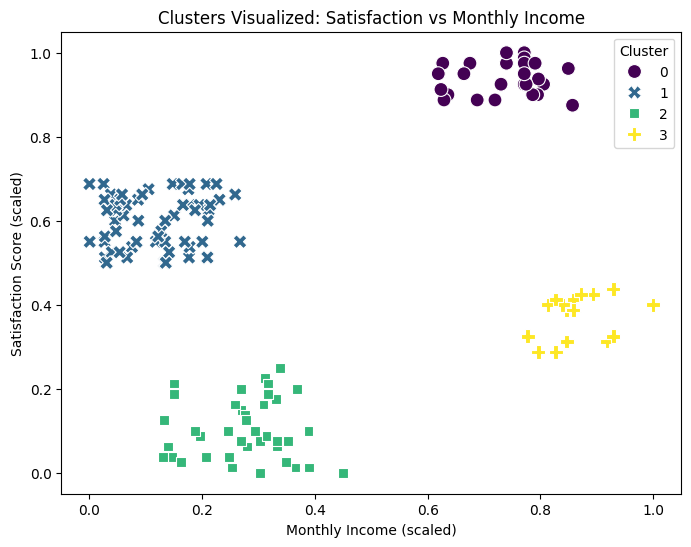
- 01High income, highly satisfied — reads as the longer-tenured, senior group. Worth retaining through mentorship roles and long-term incentives rather than pay alone.
- 02Lower income, moderately satisfied — an earlier-career profile still building tenure. Clear progression paths and competitive entry pay would matter more here than they currently seem to.
- 03Lower-to-moderate income, clearly dissatisfied — the group most worth intervening on, with performance-based recognition and skill development rather than assuming pay is the only lever.
- 04Top earners, only moderately satisfied — the clearest evidence that compensation and satisfaction aren't the same thing; better suited to an engagement survey than another pay rise.
Predicting satisfaction with a decision tree
Beyond describing segments, a decision tree classifier was trained to predict whether an employee sits above or below the satisfaction midpoint, using demographic and role features. On a held-out 20% test split it reached 86.2% accuracy — 90% precision and recall on "Satisfied", 78% on "Dissatisfied" (the softer number likely reflects the smaller class in a 142-row dataset).
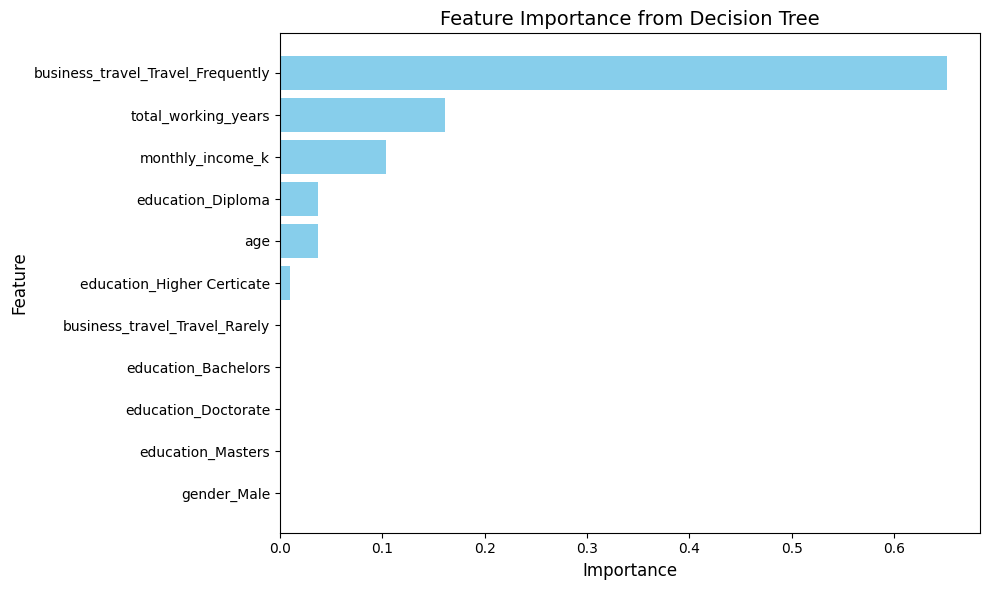
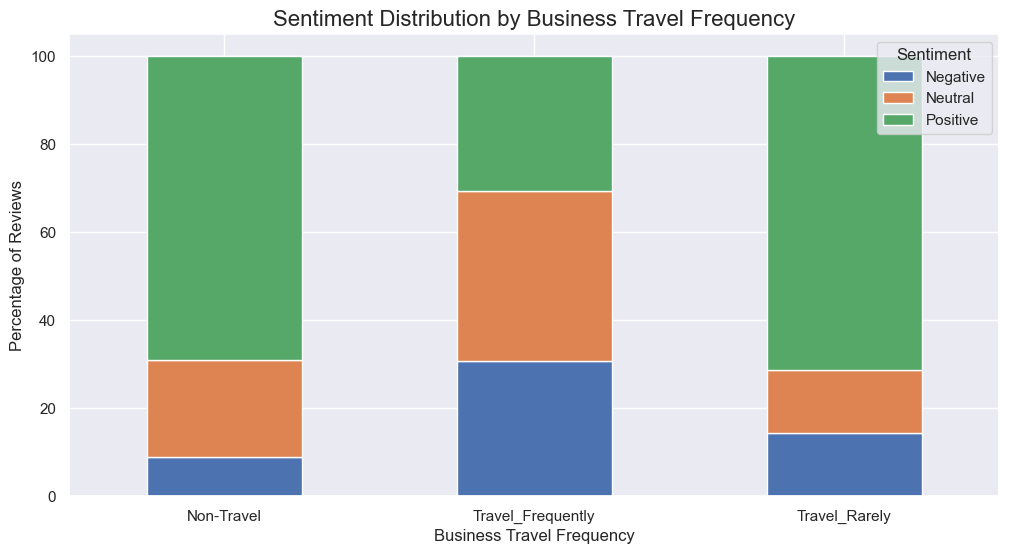
Frequent business travel is the single strongest predictor of dissatisfaction — by a wide margin over everything else the model had access to, including pay. Total working years and monthly income follow well behind it.
What employees are actually saying
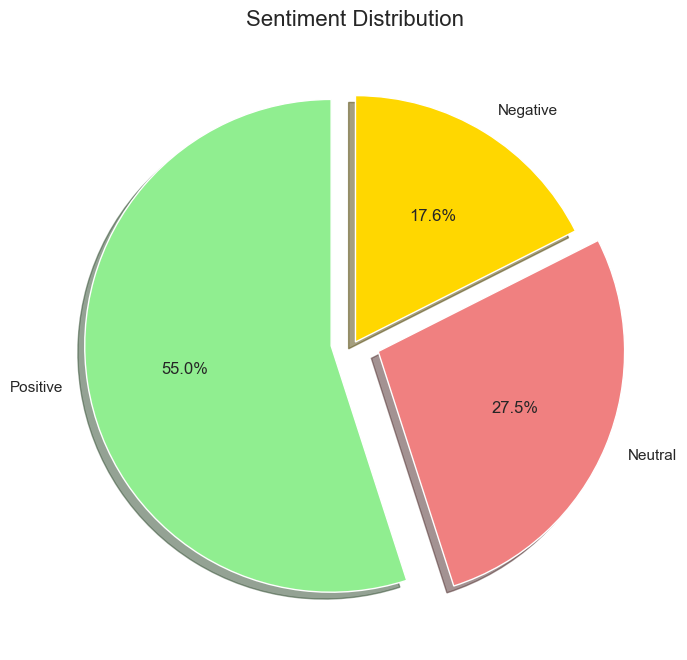
The free-text reviews were cleaned, tokenised and scored for sentiment with TextBlob. Read across all 142 reviews, feedback skews positive but not overwhelmingly so:
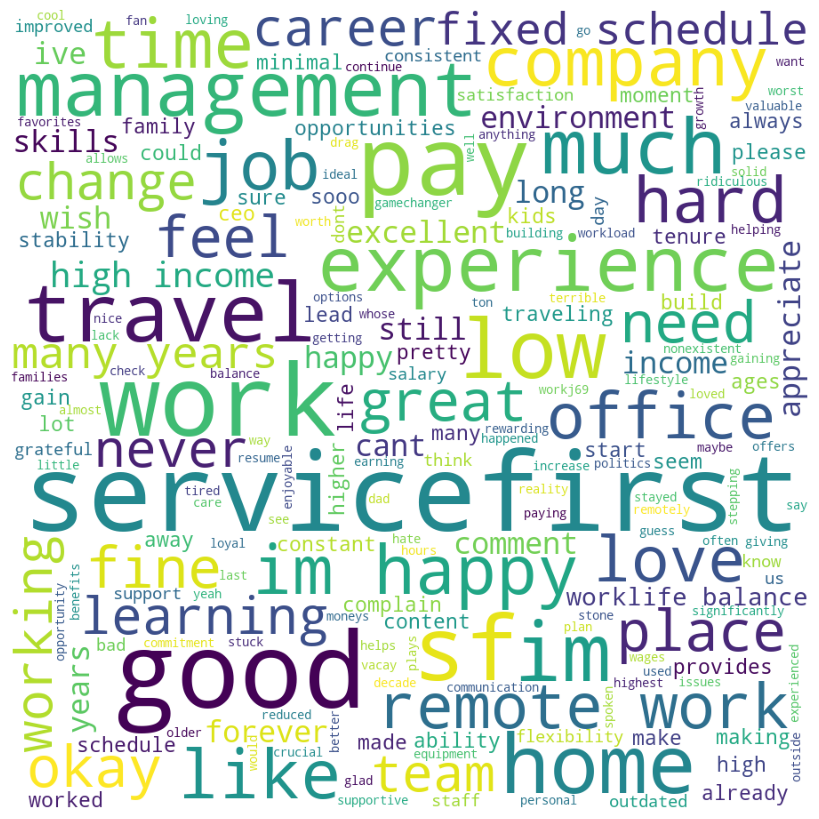
Cutting sentiment by business travel frequency lines up with the decision tree's top predictor almost exactly: frequent travellers post the highest share of negative reviews by a clear margin, while non-travellers and rare travellers skew far more positive.
The two clearest extremes: "ServiceFirst is a great start for my career, learning a lot" (most positive) against "Office politics are the worst" (most negative) — career growth and workplace culture are pulling in opposite directions.
Where this points
Three independent methods — clustering, a decision tree, and sentiment analysis of free text — converge on the same story:
- 01 Travel is the biggest lever, not pay — reworking travel policy (rotation, wellness support, flexible scheduling) would likely move satisfaction more than a compensation review would.
- 02 Two of the four segments earn well above average and are still only moderately satisfied, which points at engagement rather than income as the gap to close for higher earners.
- 03 Career growth and workplace culture dominate the positive reviews; office politics and stagnant pay dominate the negative ones — both are addressable without a blanket pay rise.